Mapping Global #Pride Discourse: A Geospatial Analysis of Twitter Data
This project implements a Python-based data pipeline to collect live Twitter data, transform it into ArcGIS-compatible CSV format, and perform spatial analysis to examine geographic patterns and relationships.
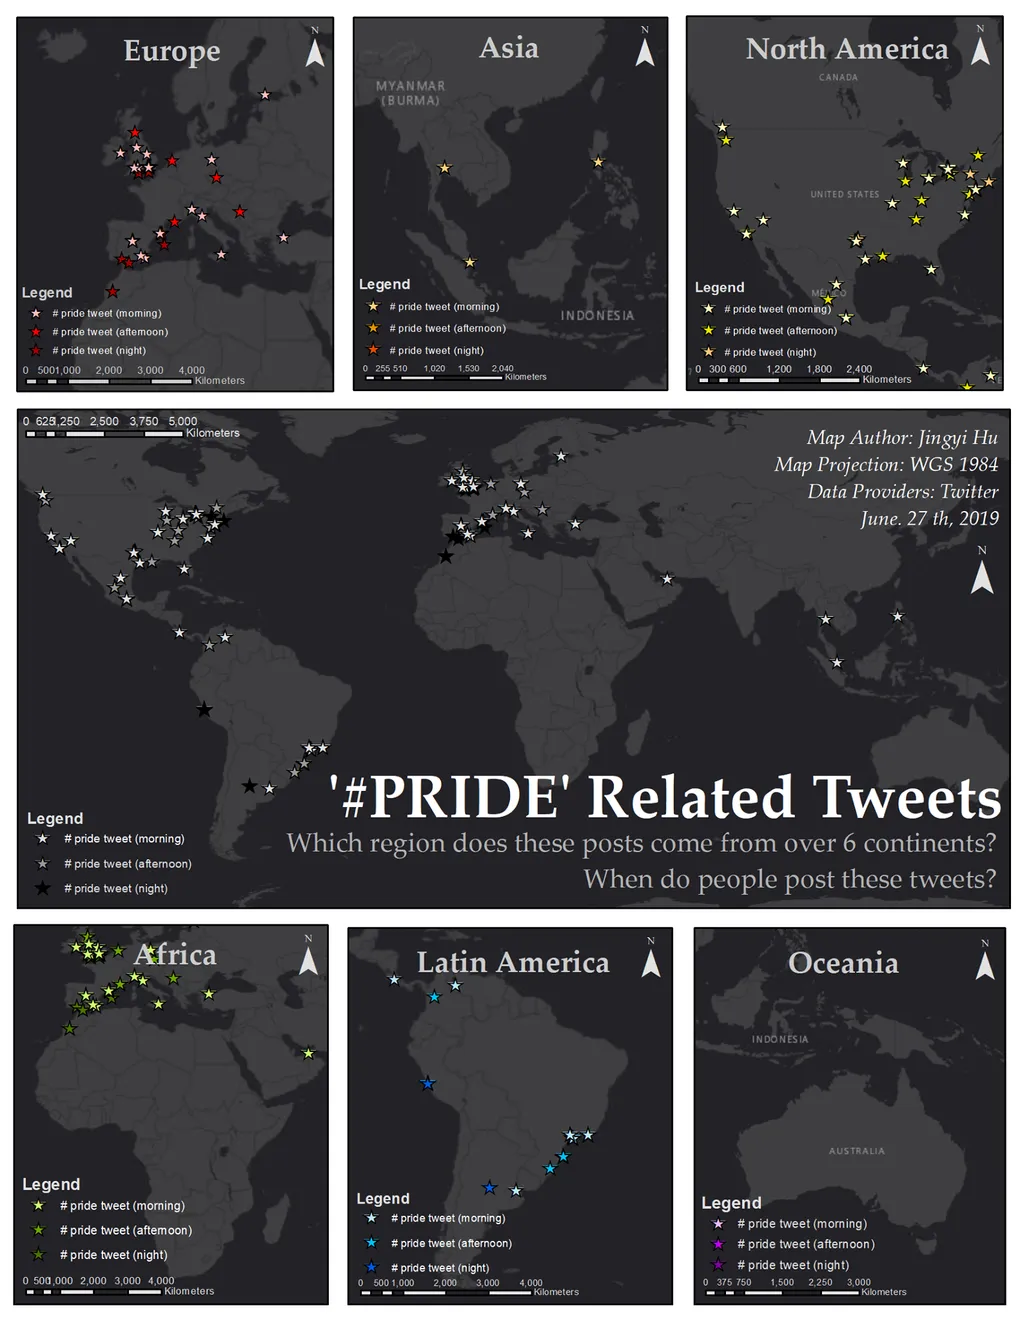
The figure visualizes the global spatial distribution of tweets containing the hashtag #Pride, aggregated across six continents and categorized by posting time (morning, afternoon, and night). Distinct spatial clusters are evident in North America and Europe, reflecting higher tweet density and sustained engagement throughout the day, while regions such as Asia, Africa, and Oceania exhibit more sparse but geographically diverse activity. The temporal differentiation highlights regional posting behaviors influenced by time zones and local social dynamics, demonstrating how social media activity related to #Pride varies both spatially and temporally at a global scale.
Data acquisition is conducted via the Twitter Developer API, using authenticated access through secure API keys. A custom
Python script leverages standard libraries (sys, pandas) alongside tweepy to stream, parse, and structure tweet data in
real time.
The workflow includes:
- API authentication & streaming initialization
- Custom data schema definition via the
CustomStreamListenerclass - Real-time ingestion, parsing, and logging during execution
The resulting dataset is exported as a structured geospatial-ready CSV, enabling seamless integration into ArcGIS for downstream spatial analytics and visualization.